I3 Project: Automated Road Segmentation for Change Detection in Cologne
Table of Contents
Abstract #
Through growingly accessible computing power and frameworks, deep learning has emerged as a promising approach to automatically extract information from images, thereby saving time and resources. This project combines earth observation (EO) data analysis with deep learning to highlight changes in the city of Cologne’s road network between the years 1998 and 2019. A U-Net architecture-based convolutional neural network is used to identify roads in areal images from the two years. The generated road maps are then compared to detect changes between the years. Due to the lack of available datasets for the study area, an aerial image road dataset of Massachusetts is used to train the deep learning model. The model interacts with the imagery data in a Python environment and is built using the TensorFlow framework. The results show significant changes in the road network. However, future research is needed to further improve the quality of the segmented road maps. The low time and effort required to generate road segmentations using the proposed approach may make it well-suited for time-sensitive mapping tasks. Future improvement of the methodology could enable usage for disaster response mapping or precise mapping of newly developing areas that lack road data. This interdisciplinary project has applications in urbanization, image understanding, and change detection. It contributes to the growing field of earth observation and deep learning. The code and pre-trained model are available on GitHub and GitLab.
Keywords: Deep Learning, Semantic Segmentation, Road Network, Change Detection
Poster #
An interactive poster, showcasing this project was presented at the GI_Salzburg Conference 2023 postersession.
GitHub #
A more detailed overview and all of the code for this project can be found on GitHub. The RChan Jupyter Notebook and the repository’s Wiki section provide instructions to run the code and replicate the results.
Project repository of automated road segmentation using a U-Net based CNN.
Paper #
For the PDF version of the paper click here
1 Introduction #
The field of earth observation (EO) provides a growing amount of earth data, including satellite and aerial imagery (Gomes et al., 2020; Sudmanns et al., 2020). EO data may be used to monitor the earth’s surface and identify potential changes for numerous application domains such as urbanization and planning, disaster management, agriculture, etc. Sudmanns et al. (2020) also describe the need for EO data to be interpreted to gather meaningful information from it. For aerial or satellite images, this traditionally includes the separate steps of segmentation and classification (Lang et al., 2019; Matsuyama, 1987). Automating such manually laborious tasks has great potential to save time and improve work efficiency. Through research, large amounts of data, and growingly accessible computing power, deep learning has emerged as a promising approach for extracting information from images and can combine segmentation and classification into one step referred to as semantic segmentation (H. Wang et al., 2017; Wu et al., 2019). This project employs semantic segmentation to perform a change detection analysis on specific sections of the road network in Cologne, Germany. A U-Net architecture-based convolutional neural network (CNN), is used to generate binary semantic segmentation masks of roads from aerial images. Using these road masks, side-by-side comparisons of the same location during different years are conducted to identify changes in the road network.
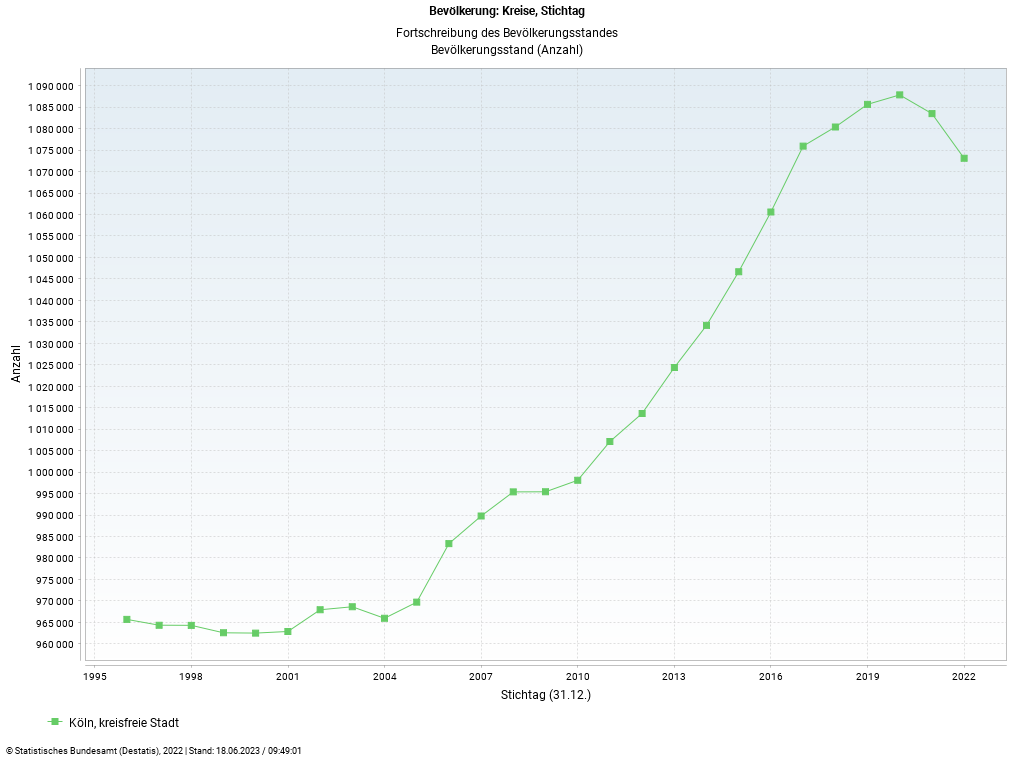
Cologne is chosen as the study area of this project, as over the past decades, Cologne’s population has seen a steady increase from 962,580 inhabitants in 1998 to 1,087,863 inhabitants in 2019 (Statistisches Bundesamt, 2023) (Figure 1). This population increase can serve as a proxy indicator for infrastructural growth, including the construction of new buildings and accompanying roads. The timeframe chosen to analyze changes is between the years 1998 and 2019.
Two main factors shall be considered to assess the quality of the model for road change detection. The first is the accuracy of the segmentation, meaning how well the predicted target maps, represent the ground truth target maps. The second factor is the time and effort taken to conduct the analysis with the trained model compared to a manual approach. As the Cologne dataset (including the road masks) was created manually, the time and effort taken for the automatic segmentation can be directly compared to the manual approach. Further factors such as cost, accessibility, and transparency may also play a role. However, these are largely outside of the scope of this paper and will not be discussed. The results of this project are expected to successfully highlight major road network changes in the study area. The segmentation accuracy is not expected to be able to match the accuracy of a manual approach due to limiting factors such as hardware and time limitations, difficult image and road conditions, and differences between training and test data. However, the deep learning segmentation is expected to significantly outperform the speed of manual segmentation.
Given the interdisciplinary application domains of image understanding and change detection, this project may provide valuable findings for a broad range of disciplines and contributes to the growing field of deep learning in EO. All code and the pre-trained model are available on GitLab.
2 Materials and Methods #
Throughout the project, a variety of technologies and software are employed. The Cologne dataset is created primarily using QGIS. The creation of the U-Net CNN model and the necessary data preprocessing and postprocessing steps are conducted using the Python programming language. The TensorFlow framework is employed to build, use, and evaluate the model. The code is deployed in a Jupyter Notebook, hosted on Google Colab. This grants access to a capable computing environment and allows for easily sharable code and reproducible results. The GitHub MobileNetV2 implementations by Raj (2020) and Tomar (2020) served as starting points for creating the deep learning workflow. The methods used throughout the entire project are detailed in this chapter.
2.1 Data #
As there is no labeled data available for the area of interest, the model is trained using the road dataset of the Massachusetts Road and Building Detection Datasets created by Mnih (2013) as part of a Ph.D. thesis. This road dataset contains 1171 3-channel aerial images of the state of Massachusetts at a resolution of 1500 × 1500 pixels where each image covers an area of 2.25 km² (Mnih, 2013). For each aerial image, the dataset contains a target map (ground truth mask) of the roads on that image. The target maps are single-channel Boolean images comprising the classes road and not-road and were created using OpenStreetMap road data (Mnih, 2013). Using a different dataset to train the model will test the model’s ability to generalize to new data.
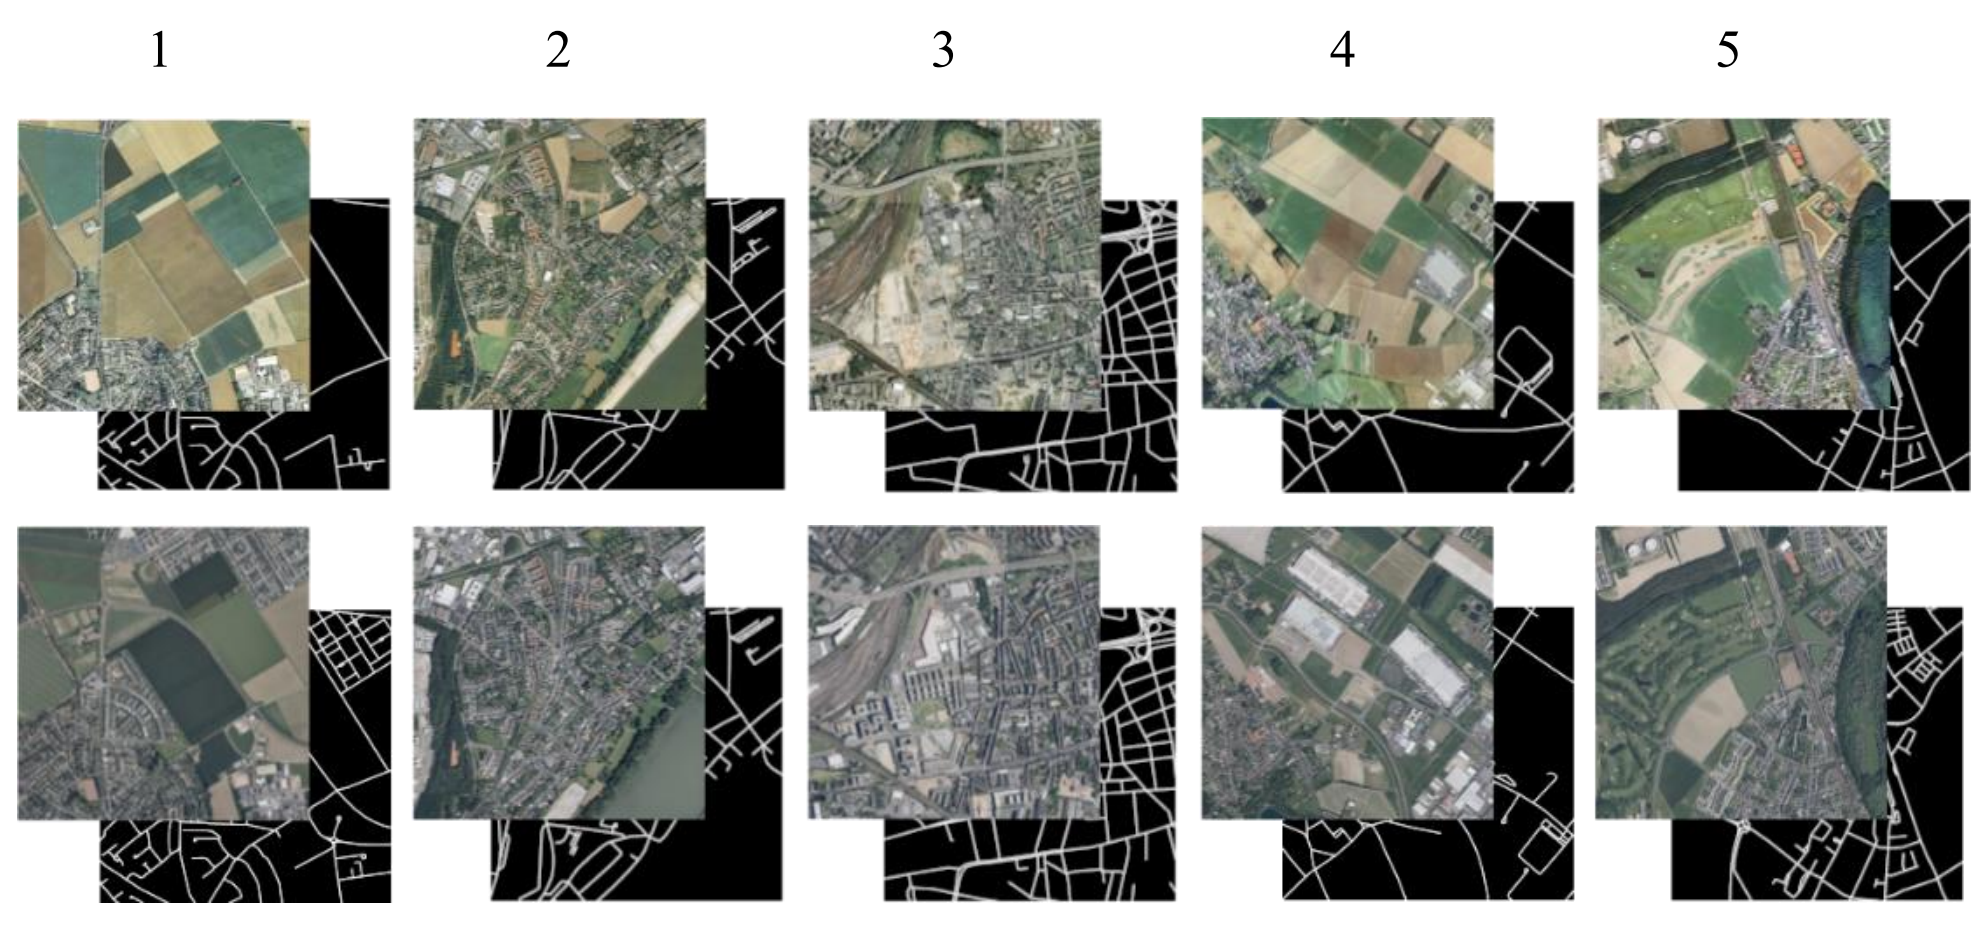
To apply the trained model to images of Cologne and conduct a change detection, a small dataset comprising five locations in Cologne is created (Figure 2). The areas of the five locations are 1: Lövenich, 2: Sürth, 3: Kalk, 4: Fühlingen, and 5: Worringen. For each location, two pairs of images each comprising an aerial image and a road mask are created. One for 1998 and one for 2019, resulting in 10 pairs of images in the Cologne dataset. The locations are chosen based on areas of suspected and confirmed road network expansion. The aerial imagery is obtained as open data provided by the state of Nordrhein-Westfalen in the form of an OGC WMS. This service offers historical digital imagery between the years of 1998 and 2020. No historical road data for the year 1998 could be found. Therefore, the target masks are created by manual delineation using the aerial imagery and OpenStreetMap data of persistent roads for reference. To improve the generalization performance of the model, the Cologne dataset is created in the same way described by Mnih (2013) for the creation of the Massachusetts training set (1500 × 1500 pixel images covering an area of 2.25 km²). This results in a 1-meter spatial resolution of the images.
2.2 Preprocessing & Postprocessing #
Before training the model, the Massachusetts road dataset is split up into a training, validation, and test set using an 80:10:10 ratio. The training set comprises 937 pairs of images and the validation and test sets both comprise 117 pairs of images.
Due to the large size of the individual raw images (particularly the 3-channel aerial images), using them as direct input to the network would require a large amount of computing resources not available for this project. Therefore, as a preprocessing step, the images are resized to a resolution of 256 × 256 pixels. This results in a 5.86-meter spatial resolution. Due to the GPU VRAM limitations of the Google Colab computing environment, this was determined to be the highest possible resolution using the proposed architecture. The images can be resized within the Jupyter Notebook (takes longer) or locally and then uploaded (faster and more reliable). The Python script created to resize the images locally can be found on GitLab. Further preprocessing steps are implemented to read the images into an appropriate form and transform the pixel values to a normalized numerical representation for the model with
where 𝑋′ is the normalized data, and 𝑋 is the original data. This divides each pixel value by the maximum possible value of 255 receive to a normalized range of 0 to 1.
Similarly, the model’s output is also postprocessed to obtain the predicted target masks of an image. For this, the model’s class prediction of each pixel between 0 and 1 is turned into a binary image by classifying all values higher than 0.5 as 1 and all values lower than 0.5 as 0.
2.3 U-Net #
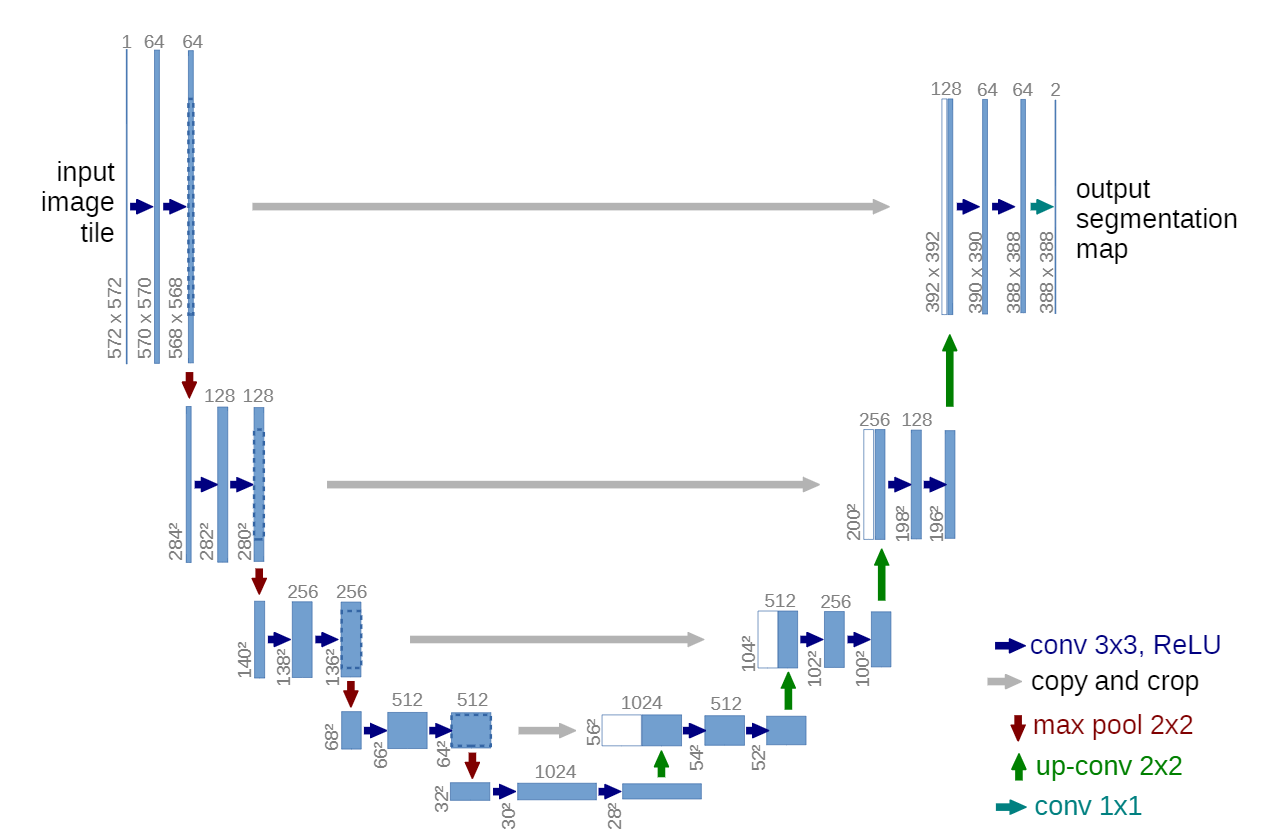
The U-Net is a popular CNN architecture, first implemented by Ronneberger et al. (2015) for biomedical image segmentation (Figure 3). The architecture consists of a contracting (encoder) and expansive (decoder) path (Ronneberger et al., 2015). The contracting path downsamples the input image to capture high-level features. The expansive path then upsamples the created feature maps, using skip connections from the contracting path to retain low-level features (Ronneberger et al., 2015; Zhang et al., 2017). The output is a segmentation of the same resolution as the input image.
The U-net created for this project, uses a MobileNetV2 (Sandler et al., 2018) encoder section with pre-trained weights on the ImageNet database (Keras, 2023). Employing this form of transfer learning, allows the U-Net to leverage the learned parameters from the large ImageNet benchmark dataset and refine them for the task of segmenting roads (Iorga & Neagoe, 2019). This allows the model to converge faster and may improve performance. The MobileNetV2 architecture is chosen for the encoder as it has been able to achieve state-of-the-art performance (Sandler et al., 2018) while being less resource-demanding than other state-of-the-art models during training and inference (Keras, 2023; Sandler et al., 2018; Tomar, 2020).
To evaluate performance during and after training, the Dice coefficient, Dice loss, Recall, and Precision are implemented as metrics. The Dice coefficient is a spatial overlap-based metric (Z. Wang et al., 2020) used as the main measure of segmentation accuracy in this project. It is used to provide a comparison between the manually delineated road masks and the automatically segmented road masks. The Dice coefficient is defined as
where 𝐷𝐶 is the Dice coefficient, 𝐴 represents the manual road delineations, and 𝐵 represents the model’s road segmentation (Dice, 1945; Shamir et al., 2018). Both 𝐴 and 𝐵 are binary sets with values of either 0 or 1. The Dice loss function is defined as 1− 𝐷𝐶. During training the goal is to maximize the Dice coefficient to achieve the best performance. To do this, hyperparameters such as the learning rate, optimizer, stopping condition, filters, and architectural parameters must be evaluated and adjusted (Jakubovitz et al., 2019; Kawaguchi et al., 2017; Lang et al., 2019; Yu & Zhu, 2020).
An important hyperparameter provided by the MobileNet architecture is the alpha value. It controls the width (number of filters per layer) of the MobileNet encoder network. Values between 0.35 and 1.4 can be used to scale the width (Keras, 2023; Sandler et al., 2018). For the created model architecture, an alpha of 0.35 results in 985,649 total parameters (977,761 trainable), while an alpha of 1.4 results in 3,186,801 total parameters (3,161,105 trainable).
To make adjustments during the training process, the following callbacks are implemented:
- The learning rate is decreased when the validation loss does not decrease for a predefined number of epochs.
- The training process is terminated if the validation loss does not decrease for a predefined number of epochs.
- After each epoch, the Dice accuracy is used to determine if a new performance peak has been reached. If so, then the current model is saved to a file.
2.4 Change Detection #
The Massachusetts test set is used to evaluate the performance of the model on very similar data to the data the model has been trained on, before applying the learned parameters to a new setting. Change detection of the road network in Cologne is conducted by using the trained model to generate target masks for the Cologne test set aerial images and visually compare the changes over time per area. Interactive image sliders are implemented to allow for the direct comparison of images.
3 Results #
After initial experimentations, evaluations, and optimizations, the model outlined in Table 1 achieved promising metrics on the Cologne dataset.
Table 1: Hyperparameters of an intermediate model achieving promising results on the Cologne test set.
| Intermediate U-Net | |
|---|---|
| Number of Layers | 153 |
| Total parameters | 985,649 |
| Trainable parameters | 977,761 |
| Input image size | 256 × 256 pixels |
| Input image format | JPG |
| Number of training epochs | 70 |
| Batch size | 32 |
| Learning rate | 1e-4 (0.0001) |
| Optimizer | Nadam |
| Alpha | 0.35 |
This model achieved a Dice accuracy of 0.38 on the Massachusetts test data and 0.27 on the Cologne test data.
Further experimentations proved that increasing only the alpha value did not positively affect the performance of the model on the Cologne dataset. However, when changing the image format from JPG to PNG, a slight increase in Dice accuracy for both test sets was noted. Observing the metrics (Dice coefficient, Dice loss, recall, precision) during training, revealed that models may not be fully converged after 70 epochs. Therefore, the maximum number of epochs was increased to 150. Different values for the initial learning rate were tested. The best performance on both test sets was observed with a learning rate of 5e-4. Performance metrics and visual results on the Cologne dataset improved further when the alpha was then raised to 0.75. Higher alpha values up to 1.4 were tested and achieved an increasingly high performance on the Massachusetts test set. The performance on the Cologne test set did not show any significant improvements.
Overall, the best Dice accuracy of 0.31 on the Cologne dataset is achieved by the model outlined in Table 2. This model achieved a Dice accuracy of 0.49 on the Massachusetts test set.
Table 2: Hyperparameters of the best-performing model on the Cologne test set.
| Best Cologne U-Net | |
|---|---|
| Number of Layers | 153 |
| Total parameters | 1,697,873 |
| Trainable parameters | 1,683,153 |
| Input image size | 256 × 256 pixels |
| Input image format | PNG |
| Number of training epochs | 150 |
| Batch size | 32 |
| Learning rate | 5e-4 (0.0001) |
| Optimizer | Nadam |
| Alpha | 0.75 |
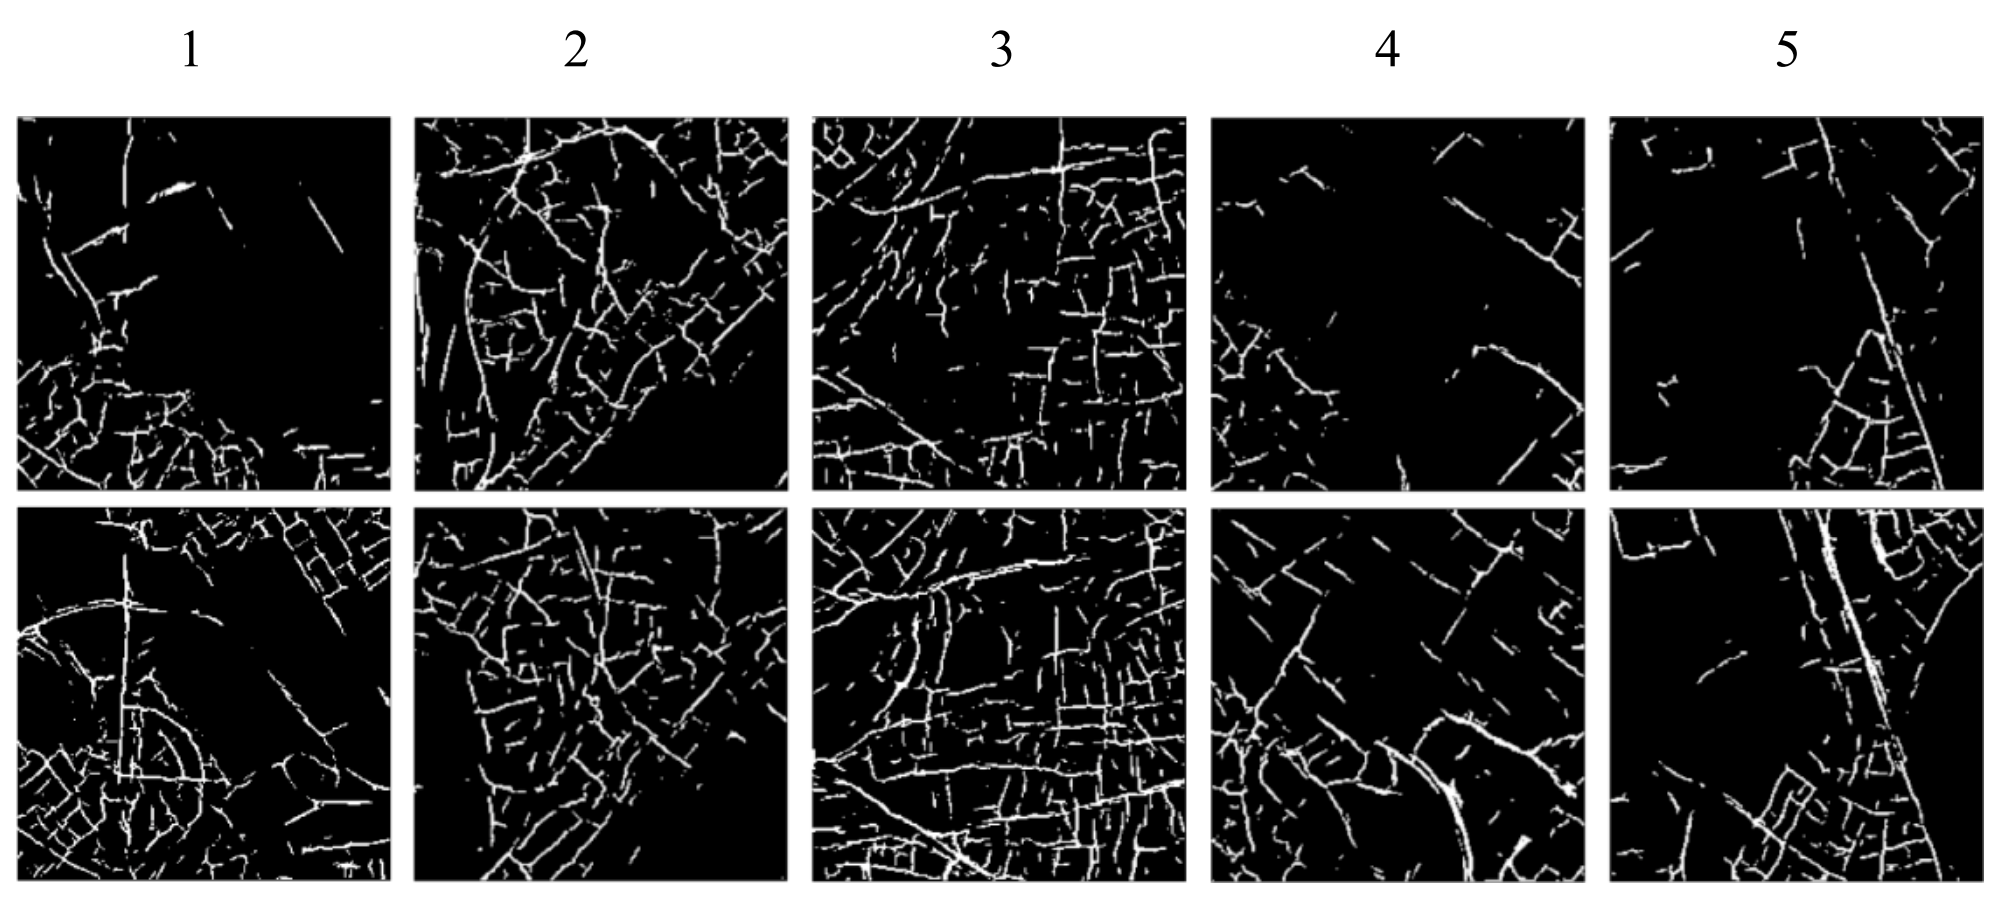
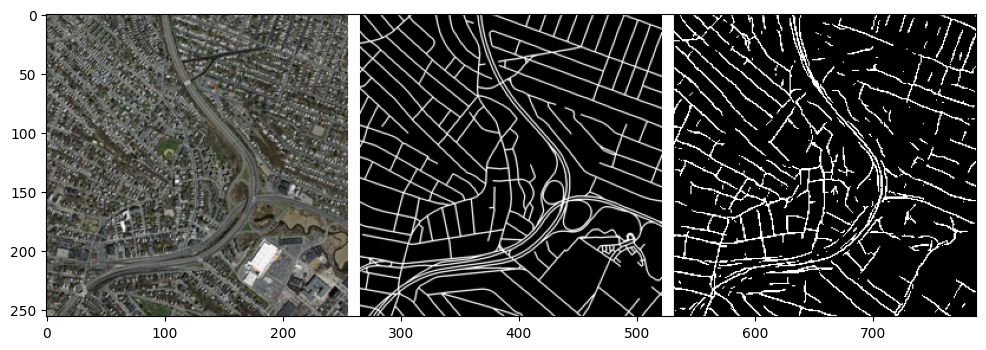
Figure 4 shows the above model’s output segmentation for the entire Cologne dataset. The more accurate results of a high alpha model on the Massachusetts test data can be seen in Figure 5.
By directly comparing the images to each other side-by-side, changes in the road network of each area can be visually identified. To more easily visually identify changes, interactive image sliders displaying the results have been created and can be used at the following web address: https://adiandawuda.com/rchan
4 Discussion #
Side-by-side comparisons of the 1998 and 2019 segmentations show the overall growth of the road network. In all images from 2019, roads that are not present in the 1998 images can be observed. When comparing the time and effort needed to perform manual delineation of roads to the semantic segmentation using a trained model, the latter is significantly more efficient. However, inspecting the change detection segmentation (Figure 4), it is clear that in its current state, the trained model has trouble identifying numerous road sections in the study area. This is confirmed by the relatively low Dice coefficient of the results.
By observing the performance of various intermediate models, it becomes clear that large Dice accuracy improvements on the Massachusetts test set do not necessarily result in improvements on the Cologne test set. When the performance on the Cologne test set does improve, it is at a significantly lower rate than on the Massachusetts test set. This shows that the models created do not generalize well. Data augmentation techniques could be employed to artificially increase the diversity of the Massachusetts training dataset to try to improve generalization and overall performance.
Using a higher image resolution during training may also significantly improve the results, as road features would be easier to recognize. At 256 × 256 pixels (5.86-meter spatial resolution), narrow and partially obscured road features cannot be identified well. Cropping individual images into multiple smaller images was briefly experimented with but did not yield any promising results for this project. However, this technique could be investigated again in more detail.
The different lighting conditions between the images from 1998 and 2019 may also influence the quality of the change detections. the aerial images from 1998 were captured during a sun-exposed day, resulting in a generally lighter color of the roads and environment. The images from 2019 were captured during a more overcast day, resulting in slightly darker colors. To reduce the effect that lighting differences have on the segmentation, a more diverse training dataset and data augmentation could be used.
Furthermore, between the two years, there have been changes in the environment that influence the model’s ability to segment roads. This includes the cover of roads by vegetation, buildings, or shadow, as well as changes in the road cover of persistent road features. In Figure 4 at location number 2, the model’s segmentation for 1998 captures a large persistent north-south leading road which in reality is present in both years. However, the 2019 segmentation largely fails to capture this feature. This is likely due to large portions of the road being obscured by trees in the 2019 aerial image, as the unobscured parts are mostly recognized in the model’s segmentation.
Employing transfer learning with different models trained on larger datasets, such as the recently released SA-1B Dataset (Kirillov et al., 2023), may also positively improve the quality of the results.
5 Conclusion and Outlook #
In conclusion, this project successfully performed change detections for five sections of the road network in Cologne between the years 1998 and 2019. The overall growth in the road network can be observed in the results. The use of deep learning to automate road detection from aerial images was successfully shown. Future research can expand on the results by working with different datasets and further optimizing model performance. In its current state, the proposed approach is useful when a general overview of a road network is required, not putting a high emphasis on accuracy. The current results can be verified and further refined using a semi-automatic or manual approach. The underlying methodology employed in this project is not limited to urbanization study and could be employed for a broad range of applications. The low time and effort required to generate road segmentations may make the methodology well-suited for time-sensitive mapping tasks, e.g., disaster response mapping. Further improvement, could also enable precise mapping of newly developing areas lacking road data.
Acknowledgments #
I would like to thank Assoc. Prof. Dr. Hermann Klug and Dr. Bernhard Zagel for their guidance and feedback throughout this project, contributing to the refinement of the deliverables.
References #
Dice, L. R. (1945). Measures of the Amount of Ecologic Association Between Species (Vol. 26, Issue 3).
Gomes, V. C. F., Queiroz, G. R., & Ferreira, K. R. (2020). An overview of platforms for big earth observation data management and analysis. In Remote Sensing (Vol. 12, Issue 8). MDPI AG. https://doi.org/10.3390/RS12081253
Iorga, C., & Neagoe, V.-E. (2019). A Deep CNN Approach with Transfer Learning for Image Recognition. ECAI 2019 - International Conference – 11th Edition.
Jakubovitz, D., Giryes, R., & Rodrigues, M. R. D. (2019). Generalization Error in Deep Learning. http://arxiv.org/abs/1808.01174
Kawaguchi, K., Bengio, Y., & Kaelbling, L. (2017). Generalization in Deep Learning. In Mathematical Aspects of Deep Learning (pp. 112–148). Cambridge University Press. https://doi.org/10.1017/9781009025096.003
Keras. (2023). MobileNet, MobileNetV2, and MobileNetV3. Https://Keras.Io/Api/Applications/Mobilenet/.
Kirillov, A., Mintun, E., Ravi, N., Mao, H., Rolland, C., Gustafson, L., Xiao, T., Whitehead, S., Berg, A. C., Lo, W.-Y., Dollár, P., & Girshick, R. (2023). Segment Anything. http://arxiv.org/abs/2304.02643
Lang, S., Hay, G. J., Baraldi, A., Tiede, D., & Blaschke, T. (2019). GEOBIA achievements and spatial opportunities in the era of big earth observation data. In ISPRS International Journal of Geo-Information (Vol. 8, Issue 11). MDPI AG. https://doi.org/10.3390/ijgi8110474
Matsuyama, T. (1987). Knowledge-Based Aerial Image Understanding Systems and Expert Systems for Image Processing. IEEE Transactions on Geoscience and Remote Sensing, GE-25(3), 305–316. https://doi.org/10.1109/TGRS.1987.289802
Mnih, V. (2013). Machine Learning for Aerial Image Labeling.
Raj, H. (2020). Building Detection using U Net and MobileNetV2. In https://github.com/HrishantRaj/Building-Detection-using-U-Net-and-MobileNetV2.
Ronneberger, O., Fischer, P., & Brox, T. (2015). U-Net: Convolutional Networks for Biomedical Image Segmentation. http://arxiv.org/abs/1505.04597
Sandler, M., Howard, A., Zhu, M., Zhmoginov, A., & Chen, L.-C. (2018). MobileNetV2: Inverted Residuals and Linear Bottlenecks. http://arxiv.org/abs/1801.04381
Shamir, R. R., Duchin, Y., Kim, J., Sapiro, G., & Harel, N. (2018). Continuous Dice Coefficient: a Method for Evaluating Probabilistic Segmentations. https://doi.org/10.1101/306977
Statistisches Bundesamt. (2023). Bevölkerung: Kreise, Stichtag. In https://www-genesis.destatis.de/genesis//online?operation=table&code=12411-0015.
Sudmanns, M., Tiede, D., Lang, S., Bergstedt, H., Trost, G., Augustin, H., Baraldi, A., & Blaschke, T. (2020). Big Earth data: disruptive changes in Earth observation data management and analysis? In International Journal of Digital Earth (Vol. 13, Issue 7, pp. 832–850). Taylor and Francis Ltd. https://doi.org/10.1080/17538947.2019.1585976
Tomar, N. K. (2020). U-Net with Pretrained MobileNetV2 as Encoder. In https://github.com/nikhilroxtomar/Unet-with-Pretrained-Encoder.
Wang, H., Wang, Y., Zhang, Q., Xiang, S., & Pan, C. (2017). Gated convolutional neural network for semantic segmentation in high-resolution images. Remote Sensing, 9(5). https://doi.org/10.3390/rs9050446
Wang, Z., Wang, E., & Zhu, Y. (2020). Image segmentation evaluation: a survey of methods. Artificial Intelligence Review, 53(8), 5637–5674. https://doi.org/10.1007/s10462-020-09830-9
Wu, H., Liu, Q., & Liu, X. (2019). A review on deep learning approaches to image classification and object segmentation. Computers, Materials and Continua, 60(2), 575–597. https://doi.org/10.32604/cmc.2019.03595
Yu, T., & Zhu, H. (2020). Hyper-Parameter Optimization: A Review of Algorithms and Applications. http://arxiv.org/abs/2003.05689
Zhang, Z., Liu, Q., & Wang, Y. (2017). Road Extraction by Deep Residual U-Net. https://doi.org/10.1109/LGRS.2018.2802944