Machine Learning: Multiclass Classification
Table of Contents
This project aims to perform a multiclass classification with machine learning methods to classify the quality of different wines depending on certain other attributes (e.g., pH, acidity, sugar, alcohol). Multiple steps of exploratory data analysis, preprocessing, and classification are conducted. The code used for this analysis has been implemented as a Google Colaboratory notebook where it can be accessed.
The data used is provided by the UC Irvine Machine Learning Repository. It consists of two datasets; one for red wine and one for white wine. The wines are related to variants of the Portuguese “Vinho Verde” wine. The classification shall be of the dataset’s quality variable, which ranges from 0 to 10.
Methods & Workflow #
The following section provides a description of the methodology and the order in which processes are implemented in the code.
Data Exploration #
As the first step, the two CSV files of the dataset containing all attributes and quality rankings of the wines are parsed, and the data is stored as pandas DataFrames. A new column indicating whether the wine is white or red is added to each DataFrame. Next, both DataFrames are combined into a single one.
The data is then visualized, and basic statistics are calculated to provide a better understanding of the structure and create a „feel“ for the features and their distributions.
Data Preprocessing #
The data is then preprocessed by one hot encoding the wine_type feature, defining the quality column as the label and separating it from the features, normalizing the features, and splitting the features and labels into train and test sets (80:20). One hot encoding is necessary to transform the categorical feature wine_type into a numerical feature, as most machine learning algorithms will require numeric data to function. Normalization of features can help to improve the performance of many machine learning models.
Classification & Feature Selection #
Two different models are created to classify the data. A simple random forest classifier using the scikit-learn library and a more complex deep learning model using TensorFlow’s Keras Sequential API.
First, the random forest classifier is trained and evaluated on the whole of the feature training set. Next, a subset of only the most important features is to be selected. This is done by using recursive feature elimination and cross-validation (RFECV). The functionality for this is provided by the scikit-learn RFECV class. This feature selection method finds the optimal number of features by iteratively removing the weakest features from the dataset and recalculating the model performance. The random forest classifier is then trained and evaluated on only the best subset of features. The performance is evaluated using the test set and compared to the model trained on the full feature set.
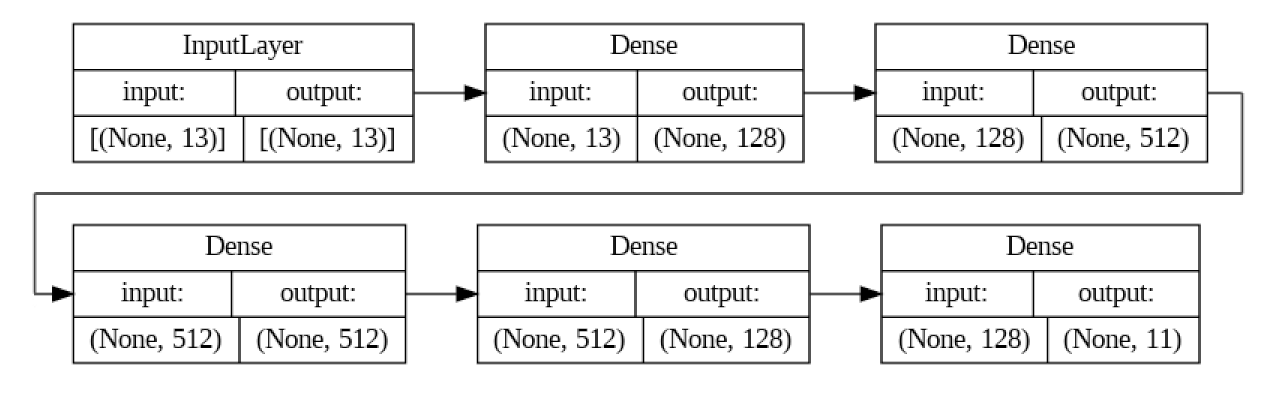
Finally two Sequential models are created using Keras. Both models share the same architecture (see figure 1) and hyperparameters; however the first is trained on the entirety of the feature set, while the second model is trained on the best subset. The models are passed one hot encoded matrices of the training labels (wine quality) along with the feature sets. Each of the eleven nodes in the output layer corresponds to one of the quality levels. The node with the highest value is taken as the classification. The accuracy, precision, recall, F1-score and confusion matrix are calculated for both models.
Results #
RFECV #
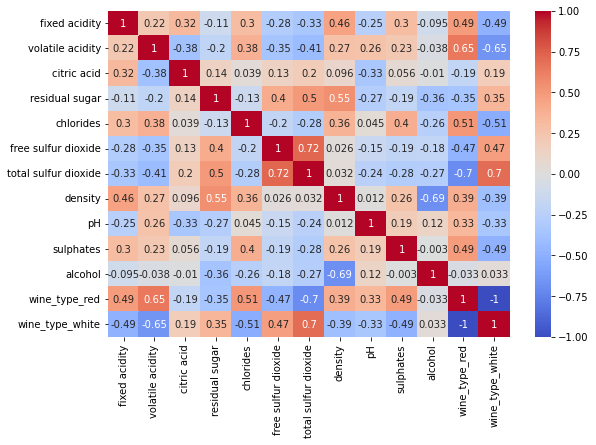
The RFECV analysis (with the default 5-fold cross-validation) of the dataset shows that the model with 11 features delivers the best scores. The two features that are left out are the color features wine_type_red and wine_type_white. This may well be due to a high correlation between these two features (if wine_type_red = 1, then wine_type_white always = 0 and vice versa) and other features, as well as a low impact on the quality of the wine. The correlation between all features, including the wine types, can be seen in figure 2.
Classification #
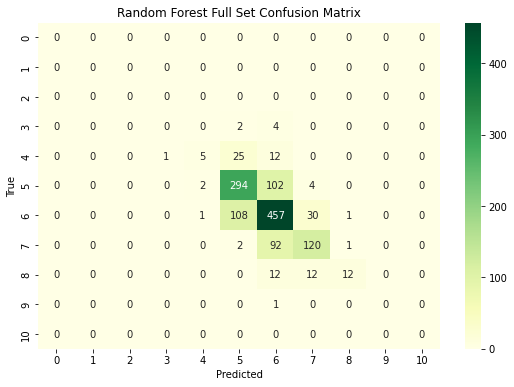
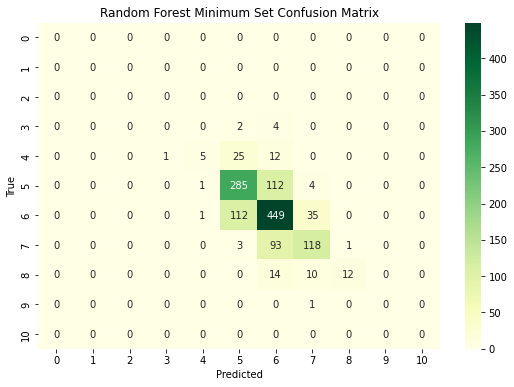
The random forest classifier trained on the full feature set achieved an accuracy of 0.6831, meaning that the quality of approximately 68.31% of the samples was classified correctly. The random forest classifier trained on the minimum feature set achieved an accuracy of 0.6685. This is a slightly worse (~1.5%) performance than the entire feature classifier. However, this difference may not be statistically significant, as the precision, recall, and F1 scores are very similar for both classifiers and the minimum feature classifier slightly outperforms the full feature classifier for the quality rating of 8. A significance test may be conducted to analyze these findings further.
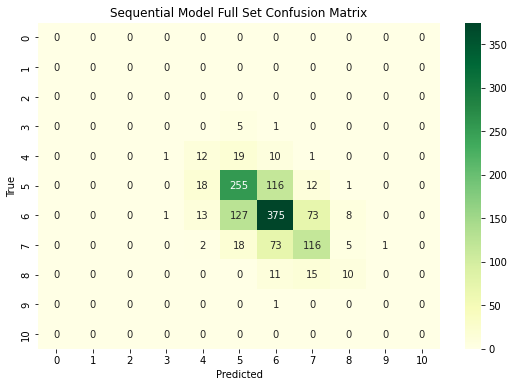
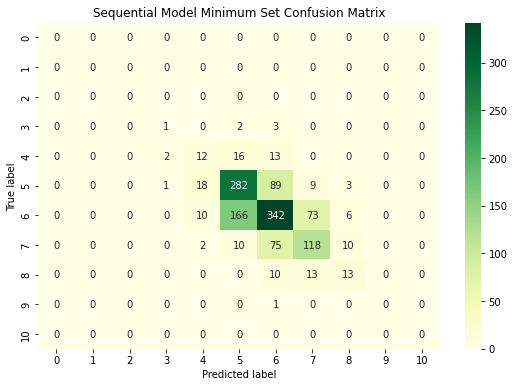
When analyzing the sequential models, both models perform very similarly to each other. the model trained on the complete feature set achieves an accuracy of 0.598, and the model trained on the minimum feature set achieves an accuracy of 0.597. The precision, recall and F1 scores for the quality ratings of 0, 1, 2 and 10 are perfect, as these ratings did not appear in the dataset at all, and no sample was classified as such. The other quality rankings provide much worse results. However, to achieve the models’ current accuracy of circa 60%, it seems that the type of wine plays no significant role. A highly-scored red wine and a highly-scored white wine may however have strongly varying attributes. Therefore knowing the wine type could play a role when trying to achieve a higher classification accuracy. Despite experimenting with the models’ hyperparameters (activation functions, number and size of layers, optimizer, learning rate, batch size, regularization), both seem to struggle classifying the quality of wine and even perform worse than the more simple random forest classifiers. By increasing the epochs, both models were able to achieve >95% accuracy on the training set. However, the performance on the test set did not significantly improve. Therefore the models were likely overfitting.
Afterthoughts #
The two datasets containing information about different wines were successfully parsed, combined and visualized. The data was preprocessed, and RFECV was employed to select a subset of the features used to predict the quality of the wine. A random forest classifier and a deep learning model were successfully trained and evaluated on both the entire and selected feature sets. Constant visualization steps (many removed from the final code) were performed throughout the development process as a form of quality control and to create a better awareness of the shape and structure of the data being used.
The random forest classifiers outperformed the deep learning models by circa 7% accuracy. However, both performed relatively poorly. Perhaps a more supervised and rigorous feature selection, and other preprocessing steps such as the identification and removal of outliers in the data, could improve the performance of all models. Further tweaking the hyperparameters or experimenting with a different model could also help in the case of the deep learning approach.
Addendum #