Geodata Acquisition: Mobile GNSS Data Acquisition I
Table of Contents
Today the capture of GNSS data has become accessible to most people via sensors built into smartphones. Although smartphone sensors are not known to have particularly high accuracy, they provide a simple, cost-effective solution for GNSS data collection. In this exercise, we use smartphone sensors to capture the position of certain types of landscape features. All features are captured inside a predefined study area and comprise point, line, and polygon data. Finally, a map of the data is created and the results are discussed.
Methods #
First, a study area is selected according to the following criteria:
- The study area should be within or around the city of Salzburg, Austria.
- The size of the study area should be between approximately 200m × 200m and 500m × 500m.
- The study area should have a good balance between developed and undeveloped land, to ensure that all significant infrastructure inside the study area can be captured in the scope of this assignment.
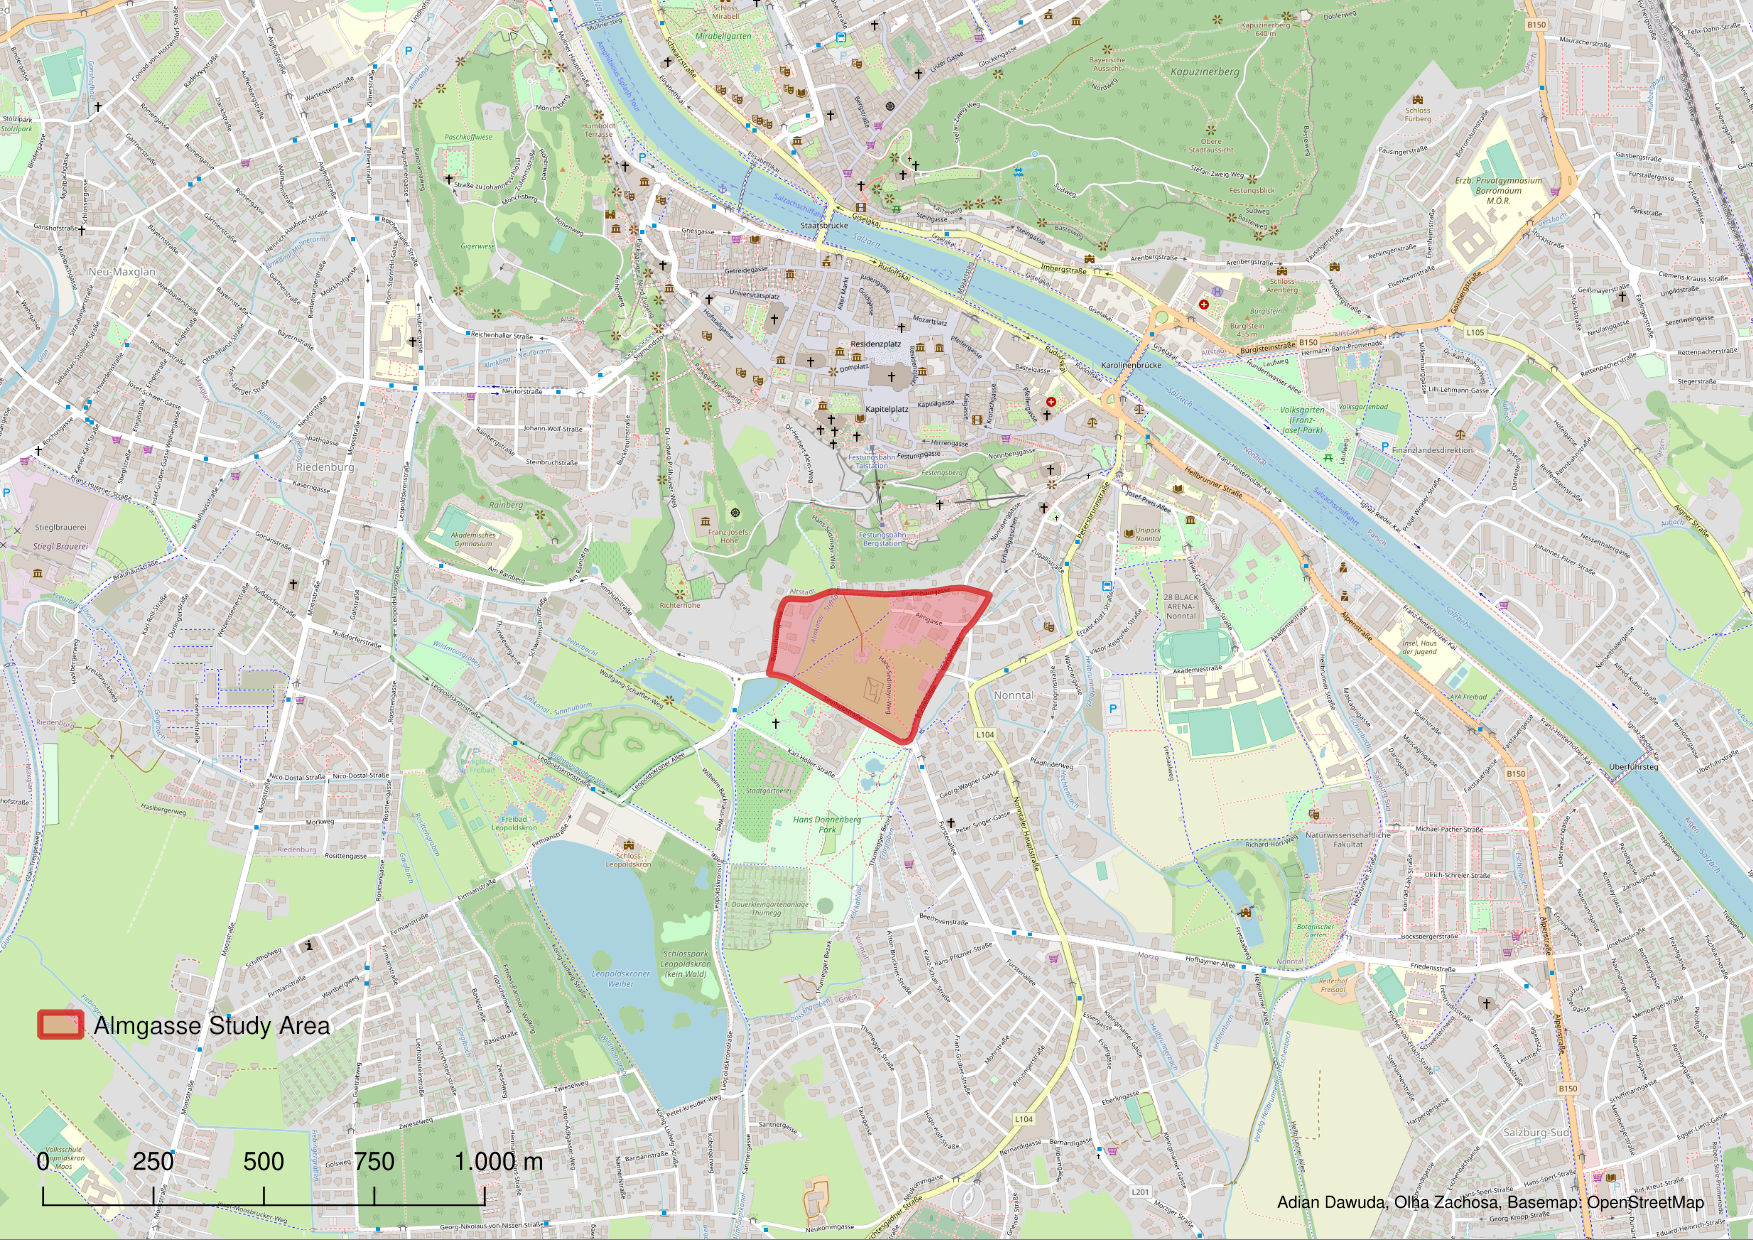
The selected study area (Figure 1) is located in Salzburg, to the south of the Festung Hohensalzburg, and to the north of the Hans-Donnenberg-Park. The Almkanal intersects the Area in the west. The borders of the area are defined by the Sinnhubstraße, Fürstenallee, Nonntaler Hauptstraße, and Brunnhausgasse. In the scope of this project, we refer to the study area as the Almgasse Area as this street runs through the center of the area.
To provide an overview and structure for the data, a data dictionary is created. The data dictionary contains all of the features we initially plan to capture. These are listed in the table below.
| Name | Description | Feature Type |
|---|---|---|
| Signs | Official park or street signs. Not including advertisements. | Point |
| Trees | Public Trees | Point |
| Streetlights | Public streetlights | Point |
| Water | Publicly accessible above-ground water features | Line |
| Paths/Roads | Public roads or paths | Line |
| Paths/Roads | Other types of objects | Polygon |
The Android application SW Maps is used to capture the data. For efficiency purposes, the data is split up, so that each group member captures different features. Below (Figure 2) is a screenshot from SW Maps showing some of the captured features.
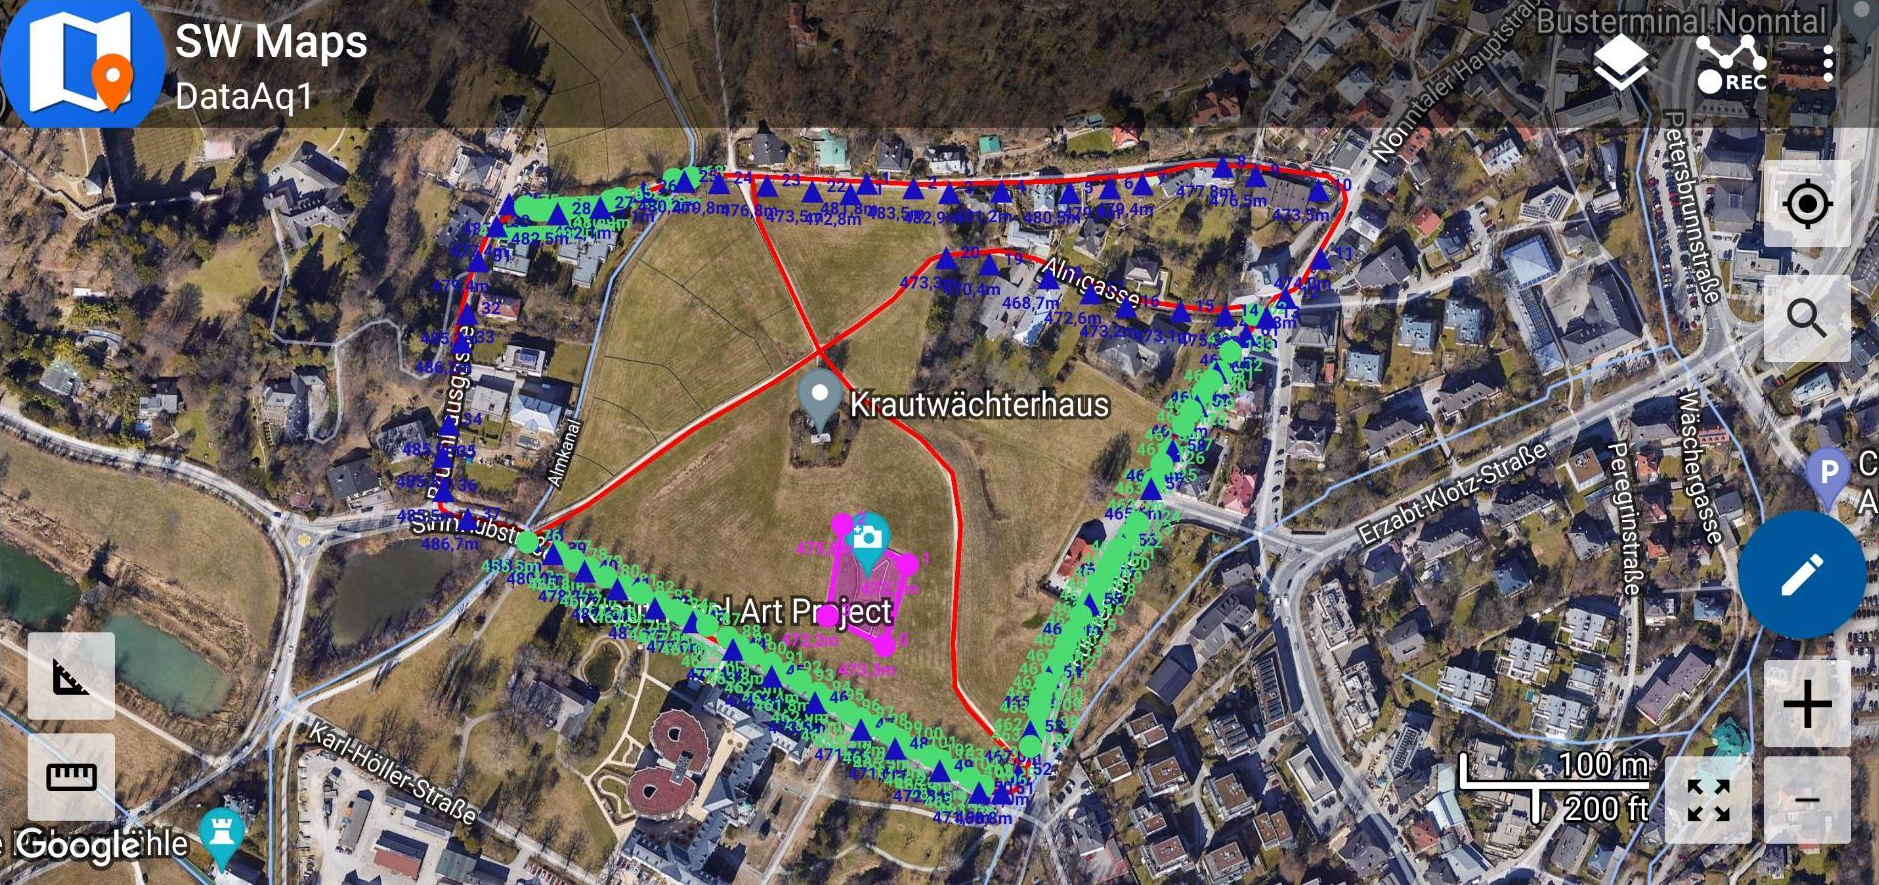
Single points and polygon vertices are captured as features using the Averaging option, thus creating more robust measurements. The average value of circa 10 measurements was used. The Paths/Roads are measured using the Record Track option with the minimum distance between points set to 2 meters and the minimum time between measurements set to 2 seconds. This automatically creates new vertices once the minimum required values are passed. Water features are measured by manually placing new vertices.
After capturing the data, the data is combined and loaded into ArcGIS Pro for visualization. The Data is transformed to the Gauss-Krüger Zone M31 (EPSG 31255) projection. This projection is well suited to accurately depict shapes and areas in Salzburg.
Results & Discussion #
The resulting map created with ArcGIS Pro can be seen in Figure 3. The map is also implemented as an ArcGIS web map.

Almost all classes in the data dictionary could be captured as planned. However, the Other Objects class ended up only containing a single feature. Therefore the class was renamed to Art Installation. This matches the type of feature that was collected.
The accuracy of the measurements varies. Since many features were captured, some measurements are quite accurate while others are poor. When observed, the position dilution of precision (PDOP) ranged between roughly 1 and 10 meters. Other factors such as the measuring device (mobile phone), atmospheric conditions, multipath effects, or obstructions between the sensor and satellites may also lower the accuracy of measurements. For general purposes, the accuracy may be “good enough”.
Afterthoughts #
The objective of this project was to capture spatial data using a GNSS sensor and visualize the results. Prior to the data collection, the Almgasse area was selected as a study area and a data dictionary with the desired features was created. SW Maps was used to capture the data, which was then combined and visualized using ArcGIS Pro. The objective of this project was successfully completed. However, follow-up work could be done to further explore and improve the accuracy of the GNSS measurements.